
The idea behind technical analysis is about studying price changes and looking for patterns that repeat — at least that is how I view it. Sometimes spotting patterns is extremely easy and other times it is far more difficult.
For cybersecurity software firm Fortinet (FTNT) the pattern was pretty simple to see. Looking at the weekly chart we see that the stock has pulled back over the last few months and appears to have found support at its 52-week moving average.
The stock moved from overbought territory to oversold territory based on the weekly stochastic readings as a result of the pullback.
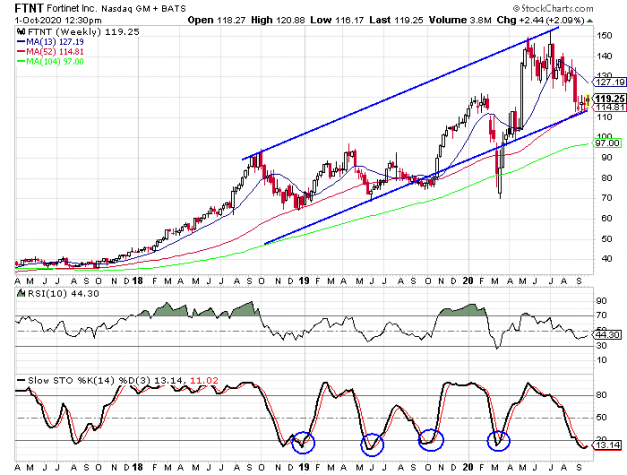
The stochastic indicators are where the pattern comes in to play. We see that since the end of 2018, the stock has rallied any time the indicators have reached oversold territory and then made a bullish crossover.
From December ’18 through April ’19, the stock rallied over 50%. From May ’19 through the high in July ’19, the stock gained just under 35%. From October ’19 through February ’20, the stock rallied 63% from its low to its high.
The selloff in February and March was an anomaly. I have referred to it as a black swan event in write-ups about other stocks and I think that is a fitting description. It was an exceptional event that saw investors selling everything because of the uncertainty surrounding the COVID-19 virus.
Investors didn’t take the time to evaluate which stocks would benefit from the changing economy, which companies would sustain business, and which companies would see drastic declines in business. They just sold everything.
Regardless of the reason for the selloff, Fortinet was oversold once again and it gained 116% from the March low to the high at the beginning of July.
So we have four rallies ranging from 35% to 116% and they all took between two and four months to play out. If we look at the average rally, it was 66%. Obviously the figures are skewed higher by the rally from March through June.
Fortinet’s fundamentals bullish
Fortinet’s earnings and revenue growth have been very impressive in recent years and that growth has held up during the current economic environment. Earnings have grown by 49% per year over the last three years and revenue has increased by 20% per year.
In the recently reported second quarter results, earnings were up 41% and revenue was up 18%. Analysts expect earnings to grow by 23% for 2020 as a whole while revenue is expected to increase by 17.7%.
The company boasts strong management efficiency measurements with a return on equity of 37% and a profit margin of 26.2%.
In addition to the strong fundamentals, the sentiment toward Fortinet is surprisingly bearish. There are 29 analysts covering the stock with only 10 “buy” ratings.
There are 18 “hold” ratings and one “sell” rating. This puts the buy percentage at 34.5% and approximately half of the average buy percentage.
The short interest ratio is at 4.85 which is above average. The ratio has jumped from 2.62 from mid-July through end of August and that suggests that the bearish sentiment is growing.
This bearish sentiment is a good thing from a contrarian viewpoint. If the bears turn bullish, it can add buying pressure and help the upward trend continue and even accelerate.
As for the best way to play the bullish signal, I like the January ’21 115-strike calls. With the stock trading at $119.55, the options are trading at $14.60. If we exclude the huge rally from March through June, the average rally from the other three signals is just shy of 50%.
If the stock rallies 50% between now and January, and using the recent low as the starting point, it would be trading just under $169. If the stock is trading that high, the options will be worth $54 and based on the current price, investors would be looking at a gain of 270%.