
-
Bitcoin is up on stronger volume, a bullish sign.
-
We need to see buying on stronger volume to confirm the rebound.
-
Don’t rush to buy until the charts support a move higher.
The crypto market has seen a big bounce this past week and it has many wondering if it’s the real thing. Is this just another bounce correction within a larger decline or is the bottom now in place? The bottom line is that it’s too early to know for sure what this week’s bounce means.
The past week has seen a bullish move in the cryptocurrency market, especially Bitcoin. The spike up on July 16th and 17th was on stronger volume and that’s a bullish sign.
We want to see buying on stronger volume and any correction or pullback on lighter volume.
One possible explanation for the spike in the price is because of short covering, which is when traders who are short BTC have to buy it back to “cover” their short position.
The spike in price is then referred to as a “short squeeze” as traders who are short rush in to quickly buy back their position.
To short BTC, like a stock, a trader borrows it from the exchange (such as on the Kraken exchange), sells it on the open market, and then hopes to buy it back at a lower price to then return it to the exchange from which it was borrowed.
Exclusive Access: Get Keene Little’s Crypto Wealth Protocol delivered to your inbox!
It is the opposite of buy low, sell high.
With the spike in price on July 17th BTC jumped above its 50-day moving average again, as it did in April before dropping back below this important moving average in May, and that’s typically a bullish sign.
Any pullback from here will ideally stay above the 50-day MA, currently near $6,730.
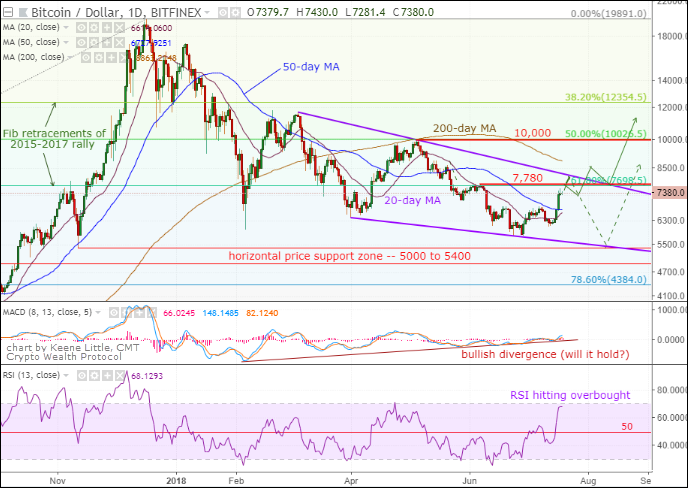
The next upside hurdle for BTC is $7,780, which is the high in May. The more important level for BTC to get above is near $8,200, which is the top of a possible descending wedge pattern (outlined with bold purple lines on the chart).
The pattern is a bullish one but it might require one more leg down to the $5,000 to $5,400 support zone before the pattern is complete. Another pullback and rally is depicted with the dashed green line.
Special Report: Learn the powerful secrets of serious cryptocurrency investors — before Wall Street catches up!
The descending wedge pattern and the potential for one more leg down to complete the pattern is the reason I suggested in the latest monthly newsletter not to chase price higher. Don’t rush to buy just because we had a nice rally this past week. I want to see BTC above $8,200 before we get a better buy signal.
Short term, BTC is now overbought, as noted on the RSI indicator at the bottom of the chart.
This is a relative strength (momentum) indicator and, like we saw last April and May, it provides a clue that we should expect at least a consolidation or pullback before continuing much higher.
