
When you look at past technological developments — from the 19th century industrial revolution through the introduction of the telephone, personal computers, Internet, and smartphones — there is a typical pattern for adoption of new technology.
Technological progress is increasing at an exponential rate. And the adoption of new technologies is also rising at an exponential rate. The adoption rate follows a typical path, often described as an ‘S’ curve. The chart below shows a few examples of new technologies and how quickly they were adopted.
The ‘S’ curve slants to the right with the lower portion of the ‘S’ depicting the phase when the new technology is slowly being adopted. At a tipping point, the adoption curve begins to accelerate to the upside. When the technology is mature and most people have accepted it, the adoption curve begins to slow its acceleration, creating the upper portion of the ‘S’ curve.
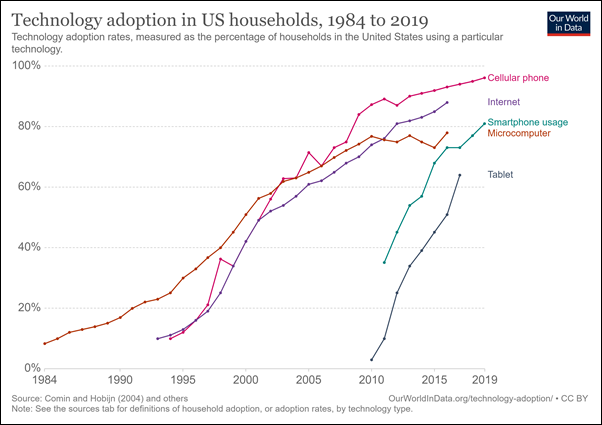
The adoption of the personal (micro) computer began in 1984 and was slow for the first decade. It took about 10 years to climb from about 10% to 25% adoption but then the curve began to accelerate higher in 1994.
Over the next eight years, the curve climbed to 60% adoption by 2002 before slowing its climb. It took another 8 years to climb to nearly 80% by 2002. It’s been running fairly flat since then.
Rapid climb
If you were to look at a stock chart for Dell (not shown here), the once-popular maker of personal computers, take a guess when it was the best time to be an investor in the company. You would have been early if you had invested before 1990, when it traded at a split-adjusted price of about $0.10.
It took 7 years from its IPO in 1988 to reach a split-adjusted price of $1.41 in 1995. The stock price then climbed rapidly in just four years to get above $50.
During the early part of the ‘S’ curve, from 1988 to 1995, Dell’s price increased 13x. That’s a nice return, but in the next 4 years, from 1995 to 1999, Dell’s price climbed nearly 35x. It was a rally almost 3 times greater than the early increase and it happened in half the time. That’s the beauty of knowing when to invest in a new technology.
You can also see on the chart above how more recent technology developments are experiencing a faster adoption curve (the ‘S’ is getting more vertical). The adoption of the tablet computer has climbed rapidly from less than 5% in 2010 to more than 60% in 2018.
So where is BTC in its adoption curve? The chart below provides some perspective. From its inception in 2009 (0% adoption), it took about 10 years to reach 15% adoption. The curve typically begins to accelerate higher once it reaches 15% to 20% adoption.
That’s where BTC is right now and it means we’re on the cusp of experiencing an accelerating adoption rate. Now is the time to invest, not when it has already achieved a high adoption rate.
If you’d like to learn more about cryptocurrencies, crypto exchanges and the state of the crypto market, sign up for a free trial of my weekly Crypto Wealth Protocol newsletter.
