
In recent newsletters I’ve been saying the higher probability move before November is for a deeper pullback correction to the March-August rally before continuing higher into next year.
My opinion about that expectation has not changed.
For one thing, the weekly momentum of the rally from March is slowing and the horizontal red line at $12,000 is still holding as resistance. At the bottom of the chart I drew a blue line from the July 2019 peak in MACD (a momentum indicator) to the lower peak in August 2020.
Compare the lower MACD high in August to the equal price high in August — this is bearish divergence and it’s a warning sign. It’s the same for RSI, below the MACD indicator.
It’s not a guarantee that the price will pull back further but it’s telling us that it’s the higher probability.
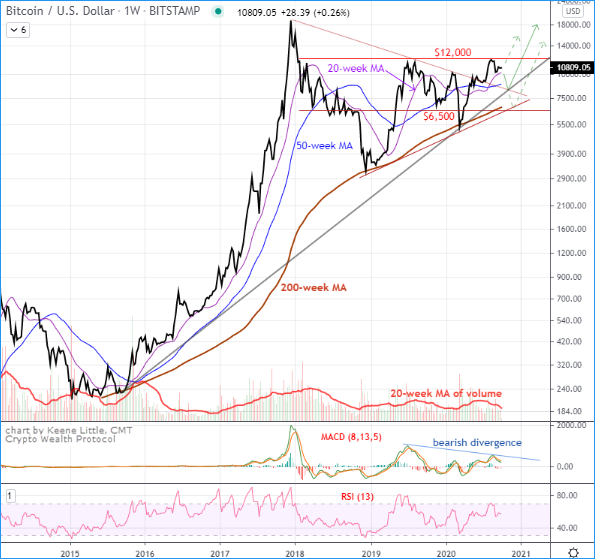
Assuming we’ll see a deeper pullback correction, there are some important moving averages and trend lines to watch for support.
From a weekly perspective, I am looking at $8,300 to $9,000 and then maybe down to $6,500 to $6,800. These numbers are close to support levels that I’ve discussed in previous newsletters when looking at the daily chart.
Even if we get a deeper retracement to $6,500, you can see on the weekly chart that it would still be a relatively small correction.
Heading into next year is when I expect the major portion of the bull market to unfold.
If you’d like to learn more about cryptocurrencies, crypto exchanges and the state of the crypto market, sign up for a free trial of my weekly Crypto Wealth Protocol newsletter.
