
You will likely hear about technical analysis during your trading experience. Technical analysis is a discipline that uses stock prices to determine signals on when to trade.
Many people swear by the practice. Others equate it to sorcery. While it may work for determining signals for stocks, can technical analysis help your options trading?
A good starting point for technical analysis is to track moving averages. These charts “smooth out” the jagged moves of a given asset price and show trends (green line below) more clearly.
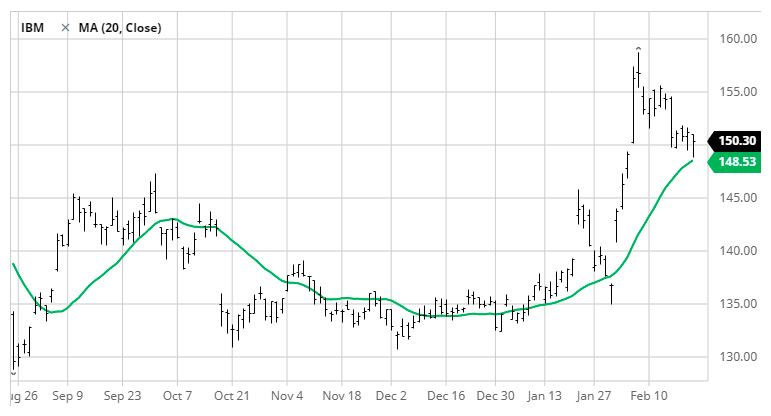
These indicators are included for free in online stock charting services such as StockCharts.com. Many traders use the 50-day moving average and the 200-day moving average. You are welcome to experiment with different configurations.
The key with moving averages is to monitor when the shorter-period indicator crosses over the longer-period one. If the crossover occurs to the upside, that is usually considered bullish. Conversely, a crossover to the downside is bearish.
Technical analysis indicators can be used for backtesting strategies. Even without the use of expensive software, traders can use a spreadsheet program for the task.
They can download the historical prices of a stock and calculate the appropriate short-term and long-term moving averages.
Traders can then use an IF() statement within the spreadsheet program to determine if the short-term moving average is higher than the longer-term one for each line item.
The cells can be color-coded to indicate whenever a change occurs. Many traders use red cells for bearish changes and green cells for bullish changes. However, traders are free to choose any colors for the purpose.
This backtesting analysis can estimate (loosely) whether options trades would have been profitable in the past. The ideal situation is to subscribe to services offering historical options chains.
However, these services are usually prohibitively expensive. Therefore, calculating an estimate using deltas of at least 0.75 (negative for puts), can give you a ballpark on whether the option strategy may have succeeded.
Essentially, you can use the intrinsic value as the premium. For calls, the intrinsic value is the stock price minus the strike price. For puts, the intrinsic value is the strike price minus the stock price.
The time value will not be available with this estimate, though. This method is only useful with in-the-money options. Further, even in-the-money options have some time value before they expire. This means the estimate won’t reflect the correct options prices.
Drawbacks of technical analysis
Many traders put too much faith in the signals indicated by technical analysis. This faith is even more dangerous for options as the temptation is to load up on contracts based on those signals.
The answer depends on the time frame for trades. Software for technical analysis tracks stock prices. Options Traders using short-term periods are not likely to benefit from using traditional technical analysis.
Rather, Greek symbol indicators are usually a better choice for short-term options. These signals are meant for options trading.
Traders use technical analysis to recognize trends. For longer-term options, finding trends can be useful. However, these trends represent stocks and not options.
If you do decide to use technical analysis for your options trading, consider choosing options with deltas of at least 0.75 (negative for puts). The closer the delta of options is to 1.00, the more the price action of options behaves like stocks.
These kinds of options undoubtedly will be more expensive, though.
Technical analysis tools that many traders use are not free, nor are they cheap. It’s not likely that casual traders (of options or stocks) will shell out big bucks for these packages, making them better suited for short-term traders. It’s helpful to define the duration of your trades to determine if the cost is worth it.