How have companies handled the cash crunch during this pandemic? I came across an insightful in-depth research report this past week that had a few interesting charts on this. See the charts below.
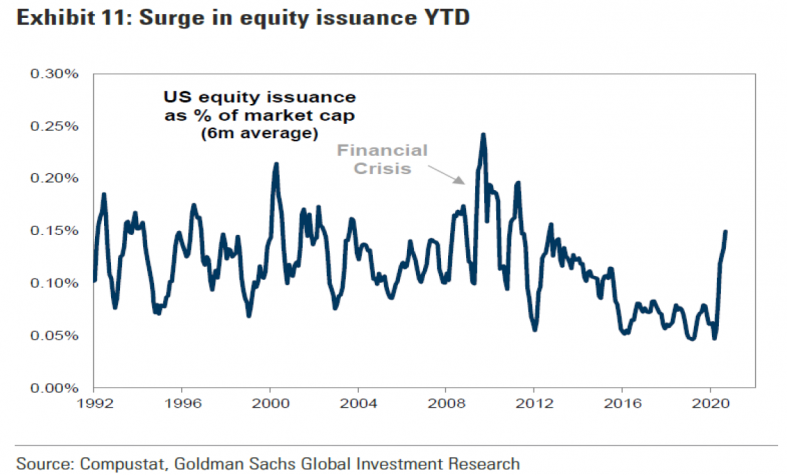
Companies responded to the crisis by issuing both equity and debt. U.S. equity issuance through the third quarter has amounted to around $320 billion.
The chart above shows this as a percentage of current market capitalization, which is at its highest level since 2012. Keep in mind a lot of this was done at very distressed market prices, as the market bottomed in late March.
In many cases, this could have been a very expensive fundraise by companies whose stock prices were decimated in the downturn.
Corporate debt has increased by around 13% over the past 12 months. Some firms tapped into lending programs offered by the government.
Others just took advantage of the very low interest rates and leveraged up through the fixed income markets directly. Refer to the chart below.
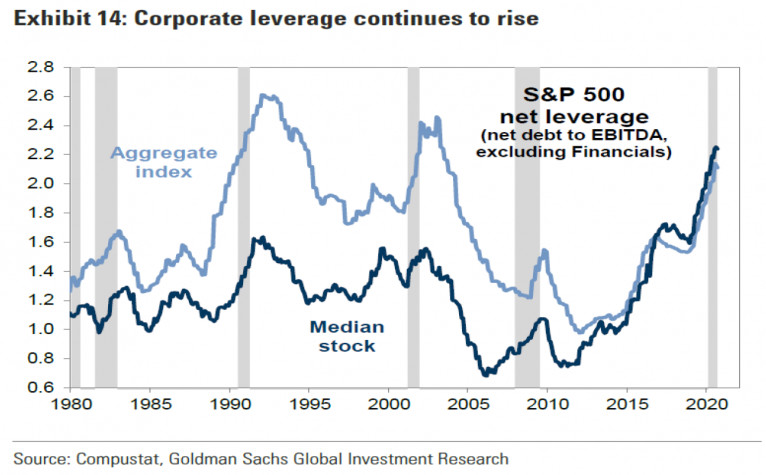
Shown in the chart is the ratio of overall net debt-to-EBITDA. EBITDA stands for earnings before interest, taxes, depreciation and amortization.
Much of this leverage actually started prior to the COVID pandemic, as seen in the chart. The ratio is now around 2.2X, the highest since the early-2000s.
This is not an issue currently with interest rates still relatively low and financing service costs still very manageable.
But how about when rates inevitably make that move up? Interest expense could become a very meaningful line on the income statement for many companies.
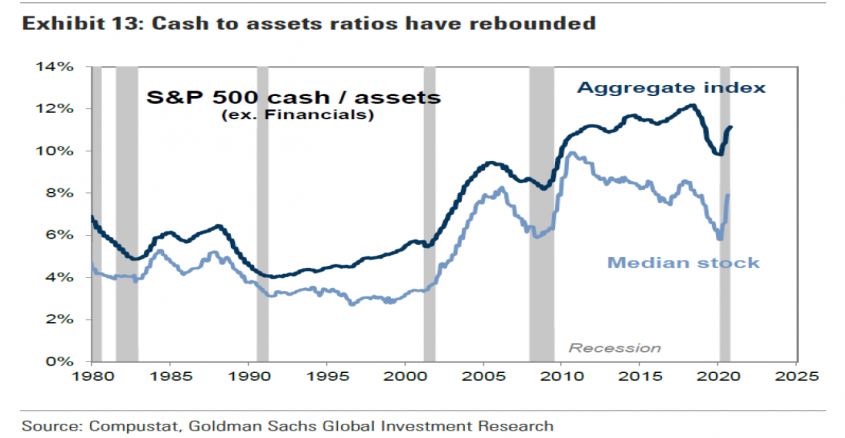
The resulting effect of all of this is that cash on hand as a percentage of total assets is now nice and high, as seen in the chart below. At the aggregate level for the S&P 500, it is around 11% of total assets, double the level during we saw in the early-2000’s.
Risky business
In summary, the cash raise by companies over the past several months has beefed up the current asset side of the balance sheet ledger, which is good.
However, it does create some potentially negative risk factors going forward.
For many companies, much of their stock was issued at low prices, making it expensive cash. Additionally, if interest rates are now at the cusp of a sustainable upturn, the elevated EBITDA leverage ratio cited above could become meaningful if loan servicing costs are notably higher.
The astute investor would be wise to keep a close watch on these factors as they analyze company financial statements.
