- Gold’s long-term chart is showing constructive signs of emerging from a base
- Market conditions mirror that of late 2015 to early 2016 when gold rallied 30%
- Fundamentals are improving as Federal Reserve eases, growth slows, political uncertainty increases
Gold has been one of the most interesting assets since the year 2000. It bottomed in 2001 around $255 and climbed for the next ten years to over $1,900.
Since gold topped in late 2011 it has provided few opportunities for bulls other than a spectacular rally from late 2015 to the summer of 2016, when it climbed 30%.
Currently, gold is providing another low-risk entry point with many similarities to this period which could generate another powerful advance in the coming months.
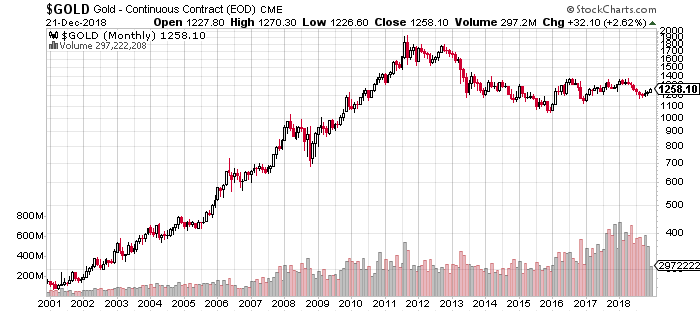
A quick look at gold’s monthly chart shows since bottoming, it has been range bound between $1,050 and $1,400.
This range has been compressing with lower highs and higher lows. Range-bound markets follow trending markets.
Bears and bulls get frustrated by the lack of volatility. These circumstances often lead to major moves and trending markets when fundamentals confirm the price action.
The latter part of gold’s bull market was driven by a belief that the Federal Reserve’s policies would lead to out of control inflation and a devalued currency.
The market environment did resemble a bubble in that people were buying based on this widespread belief and as prices rose, it made people more confident that this outcome was imminent.
At some point, the move ran out of buyers and gold’s advance turned into a plummet as the economic data refuted the buyers’ rationale.
Inflation went from close to 4% at the end of 2011 to negative in early 2015. The dollar did decline when the Fed initiated quantitative easing, however the dollar found a bid in late 2011, as it became clear that European and Asian economies were in much worse shape than the United States and were behind the curve in terms of monetary easing.
The charts below show the dollar and inflation over the last 20 years:
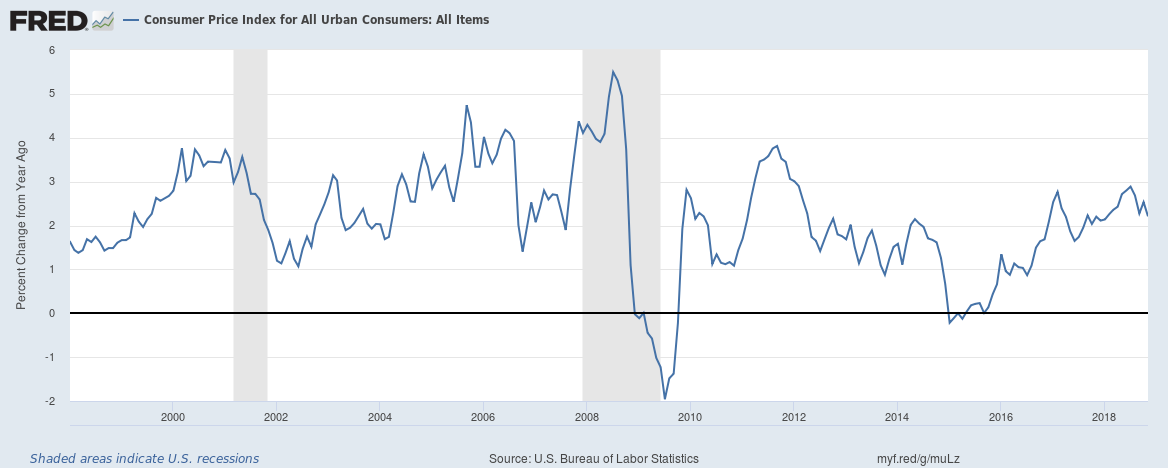
[Notice that inflation peaked in late 2011 along with gold. ]
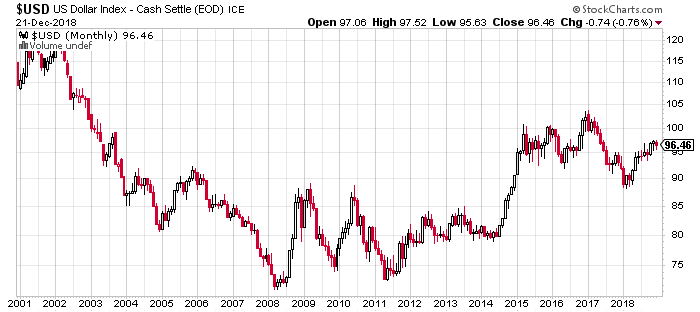
[The bull market in the dollar since late 2011 has also been another headwind for gold.]
Given the nature of parabolic moves, prices fell steeply following this high and as economic data continued to show inflation failing to take off and the Federal Reserve beginning to marginally tighten monetary policy without any ill effects on the economy.
In total, these events led to a bear market in gold.
Gold declined from over $1,900 to bottoming in late 2015 at $1,045. The steep drop and grind lower over many years effectively destroyed bullish sentiment in the sector.
At some point it found a low and rallied 30% in eight months. There were even more impressive moves in the more riskier parts of the precious metals sectors as the gold miners index, GDX, climbed 155% with more leveraged, smaller miners having larger moves.
Since then, it has largely traded between $1,150 and $1,350. However, recent developments are promising for gold.
In fact, conditions mirror this period from late 2015 when the entire precious metals sectors embarked on a massive rally.
Conditions ripe for a gold melt-up
The major similarity between both time periods is the Fed signalling a pause or modification of its hawkish rate path in response to periods of elevated market stress and economic slowdown.
In the latter period, risk assets were hit by concerns about falling growth and weakening oil prices. Oil had declined from over $100 in the fall of 2014 to under $50 by late 2015 and was in a near free-fall.
This led to a drop in economic activity in oil-producing regions and concerns about a credit crisis if energy firms would be forced to default in the event of oil being depressed for an extended period of time.
The cumulative effect of this fear, weakening asset prices, and the subsequent drop in inflation readings was the Fed delaying the beginning of its rate hikes.
The Fed went from forecasting three rate hikes in 2016 to one and actually implementing only one. This period of the Fed taking its foot off the accelerator — while it waited to see if the stress in financial markets would self-correct or compound into something worse — coincided with the explosive rally in gold prices.
- Special Report: Learn the powerful secrets of serious cryptocurrency investors — before Wall Street catches up!
The move in gold prices did not continue, because the economy and financial markets did self-correct. Growth numbers slipped for a couple of quarters, however underlying economic trends remained in expansion mode.
Currently, the Fed is entering another period where it may be forced to back off its current schedule of quarterly hikes. The stock market is 20% off its highs, credit spreads have expanded, and there is increased political uncertainty.
Events have clearly developed to a point, where the Fed will have to pause hikes and potentially shift to a dovish path if economic conditions and financial markets deteriorate further.
Officially, the Fed has two mandates: seek maximum employment and limit inflation. Unofficially, it has a third mandate, to prevent financial bubbles.
Based on inflation and inflation expectations, there is little urgency for the Fed to hike. However, the economy is near full employment which is historically highly correlated to inflation.
Given these competing demands, I believe the Fed has erred on the hawkish path in recent years, when there is frothiness in financial markets. The recent sell-off has eliminated this frothiness, and I expect the Fed to err on the dovish side, going forward.
This shift in the Fed path can potentially lead to an even more explosive rally in the precious metals sector in terms of duration and price appreciation.
Currently, gold prices have risen as stocks sold off, and it sells off when stocks catch a bid. Given the oversold nature of the stock market and the historically bullish seasonals, traders and investors should stay patient and look to accumulate precious metals on dips.
