Options investors should take the time to learn about market volatility. This measure can help investors with decisions about the overall trend of the market.
The Chicago Board Options Exchange (CBOE) created an indicator that helps investors keep track of volatility. Appropriately, this index is named the Volatility Index or VIX.
If you point your browser to any free stock quote service, such as Yahoo Finance, you can get the latest price for this volatility index. The symbol is ^VIX. For StockCharts.com, you would enter $VIX. Check with the quote service you use for any preceding symbols (^,$) needed for index quotes.
The calculation of the VIX involves using S&P 500 index options for a 30-day period. It’s not crucial for novice investors to know how the index is calculated. Investors are welcome to download and read a white paper from the CBOE that explains the concept in detail.
For this discussion, the calculation is less important than the overall level of the index. The VIX tends to be range-bound until something happens that causes it to spike. Therefore, pay attention to changes that go against the norm.
COVID-19 is a great example of an event that caused the VIX to spike. The increase in volatility coincides with an increase in fear. That is often the reason for sell-offs when significant events take place.
What VIX level matters?
The index spends most of its time in the mid-to-high teens (around 15 to 19). One way to determine a level is to download the prices and take the average of the adjusted close. Yahoo! Finance is a popular method for obtaining these prices. You can download the prices in a spreadsheet and open it with Microsoft Excel. This works with Google Sheets, too.
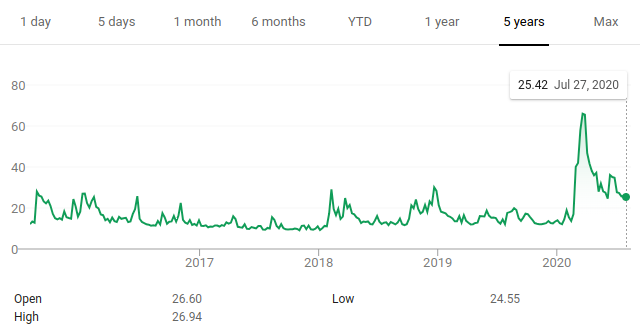
Once you open the spreadsheet, use the AVERAGE() command to find the average prices for the period you downloaded. For this article, five years from 2015 through the present were used. During the past five years the average for the VIX was just a hair over 17. If you downloaded the max time period option for VIX data, the average would be slightly over 19.
Does this mean that any spike over 17 (or 19) will result in higher overall volatility? Probably not. As mentioned previously, you’ll want to monitor the VIX for extreme changes.
As a reference, the VIX for March 16, 2020, was 82.69. March was the time when the United States was starting its lockdown period due to COVID-19.
Another interesting item to observe with the VIX is how it jumped from 17.08 on February 21 to 25.03 on February 24. The index continued to climb until its peak on March 16 of 82.69. The S&P 500 declined drastically during this same period.
Before you draw any conclusions about spikes in the VIX, be sure to scan for other spikes during less volatile periods. Then, see if there are any significant news items associated with these surges. As an exercise, you can use December of 2018 as a reference. Check news stories on or around that period.
The VIX is useful, but it measures the volatility of the market on the whole. It is not recommended to use these spikes as an indicator to trade options on individual stocks.
It’s true that most stocks often follow the market. But it’s conceivable for the VIX to be low while volatility on an individual stock surges.
In addition, seeing “prices” for the VIX may lead some investors to believe hat it can be traded. However, it is not possible to trade the index directly.
It is possible to trade the VIX via exchange-traded Funds (ETFs) or exchange-traded notes (ETNs). For novice investors, it’s best to avoid this type of trade, at least initially.
Options on the VIX are derived from futures prices. This factor makes trading them complicated.
