
Huntsman Corp. (HUN) is a chemical company based in The Woodlands, Texas. The company issued second-quarter earnings results on Tuesday and it beat on both the top and bottom line. Initially the stock gapped higher on the news, but then it made a complete reversal and closed down over 5% on the day. The reversal kept a long-term downward trend in play and to me it looks like that trend will continue for the next few months.
Looking at a weekly chart for Huntsman we see that the stock peaked in early 2018 and has been trending lower ever since. That high is the starting point for the upper rail of a downwardly sloped trend channel and the stock moved slightly above the upper rail on Tuesday before reversing lower.
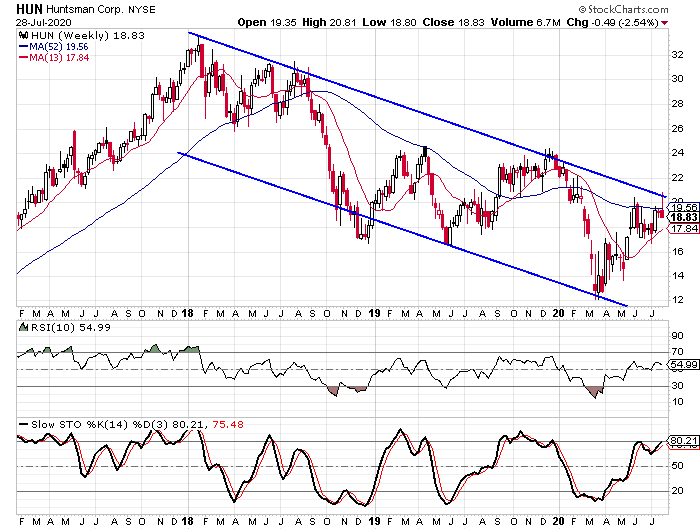
The move above the upper rail wasn’t the first instance where the stock moved above the potential resistance point only to reverse lower. In this case there is also the matter of the stock moving above its 13-week moving average, but then dropping back below the trend line. We saw a similar setup back in August ’18 and that was the beginning of a decline that took the stock from the $30 range down to the $17 area.
The fundamentals are below average and getting worse
While the chart makes a pretty good case for the downward trend continuing, the fundamentals aren’t helping the stock either. Over the last three years Huntsman has seen earnings decline by an average of 16% per year while revenue has declined by an average of 8%. In the second quarter, earnings were down 130% from the second quarter of 2019 and revenue was down 30%.
Personally I use Investor’s Business Daily’s EPS and SMR rating scores as a means to get a quick snapshot of what a company’s fundamental indicators look like. The EPS rating measures a company’s earnings growth over the last three years with a heavier weighting on the most recent quarters. The rating system runs from 1 to 99 with companies scoring a 99 being the ones with the best earnings growth.
The SMR rating measures a company’s sales growth, profit margin, and return on equity. The SMR readings range from A to E with the best companies getting “A” ratings and the worst companies getting “E” ratings.
Huntsman scores a 24 on the EPS rating scale and it gets an SMR grade of a D. Those are pretty poor ratings, and they got worse after the earnings report. Prior to the earnings report on Tuesday, the EPS rating was a 38 and the SMR rating was a C.
Another factor that could help push Huntsman lower is the sentiment toward the stock. It isn’t extremely optimistic, but it is more optimistic than it should be based on the fundamentals and the chart. There are 20 analysts covering the stock currently with 12 “buy” ratings, seven “hold” ratings, and one “sell” rating. This means the buy percentage is 60% and that is only slightly below the average stock. If the fundamentals were average I would be okay with this buy percentage. But Huntsman’s fundamentals are well below average.
The short interest ratio for Huntsman is only 1.6 and that is also indicative of a more optimistic view than the stock should have. The average short interest ratio is in the 3.0 range.
What we have is the combination of a downward trending stock, poor fundamentals, and sentiment that is more bullish than it should be. That is a great recipe for a bearish trade in my opinion.
Given this setup, I suggest taking advantage by buying put options on Huntsman. Because I think this trend will play out over the next few months, I think the November option series offer the best risk/reward scenario. The November 22-strike puts are currently trading for $4.00 with the stock trading just above $19. If the stock drops back down to the $12 range like I think it will, the November 22-strike puts will be worth $10.00 based on the intrinsic value. That would be a 150% gain if it plays out. I would also suggest a stop if the stock reaches $21.50.
