
If we go back to February 19, when the S&P 500 peaked at what was an all-time high at the time, the market has gone through five phases since then.
The first phase was the incredibly steep selloff in stocks with the index falling 34%. During this first phase, the worst performing sector of the main 11 sectors was the energy sector.
For tracking purposes, I have used the select sector SPDRs that represent the 11 sectors as proxies to show the returns during the different phases.
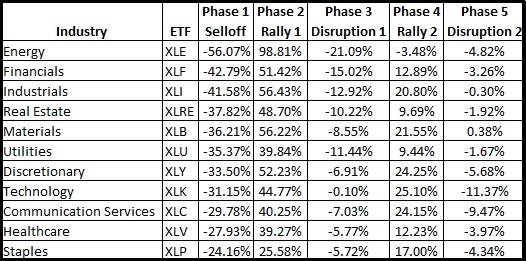
What we see in the table is that the Energy Select Sector (SPDR) was the worst performer in the first phase, the selloff. The ETF dropped 56.07% from February 19 through the low on March 23.
The second phase for the market occurred from the low on March 23 through June 8. We will call this phase Rally 1.
During Rally 1, the Energy Select Sector SPDR led the way with a gain of 98.81%. You may also notice that the Consumer Staples Select Sector SPDR (XLP) was the best performer during phase 1 and the worst performer in phase 2.
Phase 3 is what I’m calling Disruption 1 and it occurred from June 8 through June 29. It’s hard to call this phase a bearish phase, but it is readily apparent on the chart as the S&P trended between the 3,200 level and the 3,000 level during this stretch.
During Phase 3, the Technology Select Sector SPDR (XLK) held up better than any other sector, only losing 0.1% during this time. The worst performer during Phase 3 was the XLE with a loss of 21.09%. So the XLE went from top performer in Phase 2 to worst performer in Phase 3.
A second rally with new leadership
Now we move to Phase 4 which I call Rally 2.
This phase lasted from June 29 through September 2. During this phase the top performer was the Technology Select Sector SPDR with a gain of 25.1%. Just to keep you up to date, the XLK was the top performer in Disruption 1 and now it was the leader in Rally 2.
Phase 4 came to an end on September 2 and we entered Phase 5 when we entered Disruption 2. Once again, it’s hard to call what has happened so far a correction or a pullback, but on the chart, so far it just looks like a disruption in the second rally. From September 2 through midday on September 17, the XLK is down 11.37% — the worst performer of the bunch.
The only sector that has gained ground is the materials sector. The Materials Select Sector SPDR (XLB) is up 0.38% while the Industrial Select Sector SPDR (XLI) is close behind with a loss of only 0.30%.
To recap the pattern here, the XLE was the leader in Rally 1 and then the worst performer in Disruption 1. The XLK was the top performer in Disruption 1 and the top performer in Rally 2. It is now the worst performer in Disruption 2. Now the XLB is the top performer in Disruption 2 and I think it will be the top performer for the next few months.
This isn’t just based solely on the pattern. There is also historical data that shows when the economy is starting to recover from a recession the materials sector and the industrial sector tend to outperform other sectors.
I like the idea of using the December 62-strike calls to play what I believe will be the next rally in the Materials Select Sector SPDR. The options are currently priced at $6.40 with the ETF trading at $66.40.
During the second rally, Phase 4, the XLB gained right at 20%. A similar move this time would put the fund at $75.80 and the 62-strike calls would be worth $13.80, a gain of 115% from the current price.
