
- Many mistake a slowing economy with an economy that’s going into recession.
- Stimulus from lower interest rates has offset slowdown from trade, at least in the United States.
- Conditions are ripe for a multi-month rally
One of the persistent themes of 2019 has been constant chatter about an imminent recession. The irony is that this has been a great year for stocks, with the S&P 500 up 26.4% since the beginning of the year.
Since then, stocks have smoothly trended higher amid a pattern of higher highs and lower lows. Back in January, we highlighted that conditions were ripe for a powerful trending, multi-month rally. Now that trends seems to be upon us.
While those focused on price action would insist that the bull market came back, anyone focused on the news or even assets that are leveraged to economic growth would have a different opinion.
And there certainly has been plenty of bearish developments, including an inverted yield curve, slowing growth in export-oriented sectors, weakness in industrial production, and a slowdown across the global economy.
While these things happen during a recession, it’s important to note that just because they happen does not mean we’re in a recession.
Stocks that are more cyclical, such as Caterpillar, Ford, Deere, and US Steel have serially underperformed. Adding to these concerns was the trade war, which added an additional degree of uncertainty in addition to negatively affecting global trade.
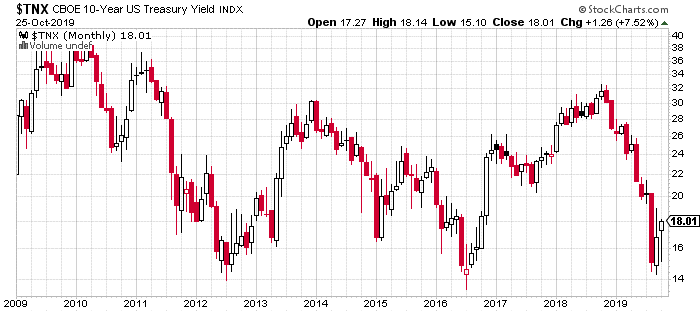
These developments resulted in a dramatic decline in interest rates from October 2018 that continued until September 2019. The chart of the 10-year note below shows this decline from above 3% to nearly testing the cycle-lows before modestly bouncing just over 1.40%.
While these recessionary clues have been amplified by the public and the media, there have also been an equal number of bullish developments that are inconsistent with an economy on the verge of a recession.
In fact, they make the recession argument seem ludicrous and blind one to the potential that the market is on the verge of an explosive trending move higher.
Alternative view
A much more reasonable but less sensational narrative is that overall the economy continues to grow but has lost momentum since October 2018.
Certain parts of the economy are probably in a recession but other areas of the economy have grown enough to offset this on an aggregate level. While most investors are fixated on backward-looking indicators that reflect slowing economic momentum, they are oblivious to forward-looking indicators which may already be discounting a turn in the business cycle.
Importantly, this narrative allows one to acknowledge the bearish data which asset prices have been responding to over the past year while also being open to forward-looking data that paints a different picture.
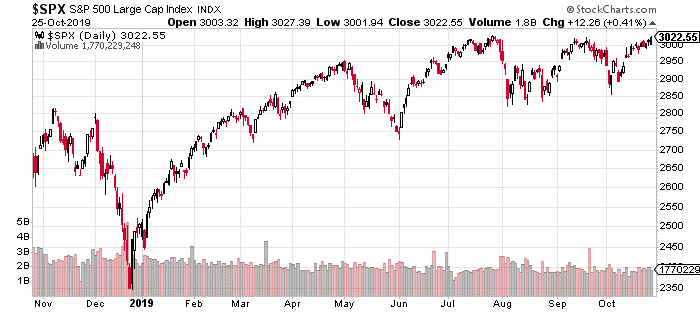
The most obviously bullish development is the stock market, which is hitting all-time highs. Since May when the stock market retested its highs from October 2019, the S&P 500 has basically been in a triangle pattern with higher lows and lower highs.
This pattern tends to resolve with a meaningful move in either direction, while consolidating price in a tight range and working off any overbought or oversold readings.
Strong market breadth
The most compelling reason to believe that this pattern resolves higher is the strength in market breadth, which shows that money is moving to stocks at the individual level.
Below is the cumulative NYSE Advance/Decline Line which is another indication of how the stock market is doing from a bottoms-up perspective. Clearly, the chart shows that breadth is leading price higher.
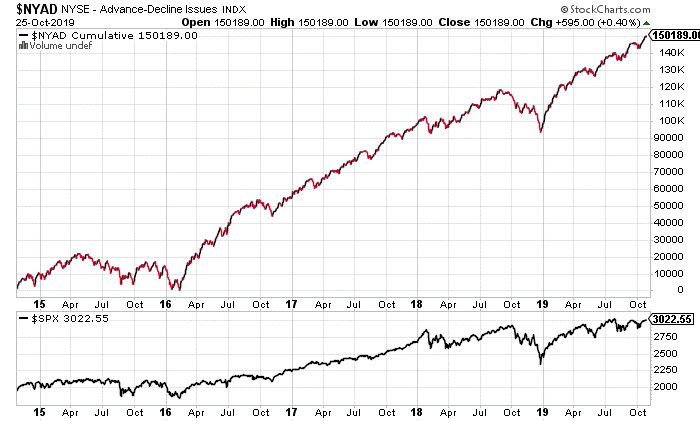
It would be concerning if prices were breaking out to new highs but breadth was failing to confirm. This would indicate that money moving into the market was concentrated in the most liquid, high market cap stocks rather than all across the market.
Market moves with low participation tend to be short-lived and prone to reversal, while market moves with strong breadth tend to trend for weeks if not months, especially when sentiment is too bearish or bullish.
Bearish sentiment prevails
And sentiment has been absurdly bearish, given the S&P 500. Typically, one would expect sentiment to be obnoxiously bullish if stocks were at all-time highs. However the sentiment charts show it remains far from exuberant levels and closer to pessimism.
Sentiment reveals that investors are not exposed to stocks in a meaningful way. If stocks move higher from here, they will be forced to quickly add exposure which will only bid up stocks even more. The picture gets even more exciting when one considers that the average equity-only fund is up close to 10% this year, and the average hedge fund is up 9%.
Essentially, they are lagging the S&P 500 massively. They currently may be underexposed to the market, because they are thinking about portfolio risk. However if stocks do break out and continue higher, this might be replaced with career risk.
Career risk is about explaining to your boss and investors why you were on the sidelines when stocks were zooming higher.
Basically, conditions are optimal for a year-end rally. This combination of underperformance and underexposure are common in the biggest year-end rallies such as 2016 and 2017. There’s reason to believe that this year could be even more explosive given that there’s more underperformance and underexposure than previous years.
Another bullish development is more subtle, but it indicates a change in market conditions and investor behavior. Stocks with bad earnings are being bought.
This was most recently seen with Amazon and Caterpillar. Both stocks have been under distribution since last year, and both missed on earnings by a significant margin. Amazon gapped down by more than 5% and finished down only 1%. Caterpillar gapped higher after missing earnings and giving guidance below expectations.
This type of reaction to bad news reflects that earnings are backwards- looking, while equities are forward looking. So we are seeing at the individual level, equities are looking past bad news, just like the broader stock market.
The playbook
Given the favorable setup and low-risk nature of the trade, traders should look to be aggressive on any breakout. There is considerable firepower that could lead to a meaningful move higher above this 3,000 level, which has been a formidable line of resistance for most of the year.
