The financial market cycle that followed the great financial crisis of 2008-2009 was associated with sharply declining inflation expectations. Long-term nominal GDP expectations slowed, as did revenue growth in the corporate sector outside of the technology area.
The period since 2009 can certainly be described as deflationary. We had significant declines in interest rates over this period, with massive monetary stimulus and now massive fiscal stimulus as a response to COVID-19.
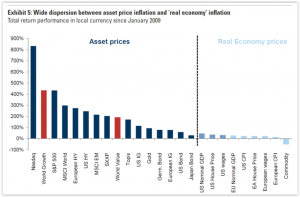
The net effect of all of this is shown in the chart below which spans the years 2009-2020. As seen, financial asset price returns have far exceeded real economy price returns.
The variance is really quite striking when presented in the way this chart shows the return relationships.

The shift towards the combination of huge monetary support and fiscal expansion, which we have undergone over the past several months, coupled with a very strong synchronized economic rebound as COVID-19 vaccination take hold, in my opinion raises the probability of a reflationary cycle start to build.
If this were to start to play out, this chart will start to tip in a see-saw fashion.
The right-hand side of the chart will slowly start moving up (higher interest rates, higher commodity prices, higher inflation), while the left-hand side slowly starts moving down (slowing equity market returns, slowing bond market returns, possible reversal of tightening high yield credit spreads).
Mean reversion
How might investors take advantage of this reflationary rotation in the markets? Proactive positions in asset classes such as commodities, including industrial and precious metals, agricultural products, food items, energy, etc. come to mind.
Additionally, although the housing market has certainly been robust for several quarters now, having a position in real estate would qualify as well.
The great Peter Allen song entitled “Everything Old is New Again” might seem to apply to this situation. Welcome to the world of financial markets and reversion to the mean!


