
Many years ago I was invited in to my oldest son’s classroom to talk to the kids about what I do for a living. These were fourth graders and obviously I didn’t want to get too deep with them about how stocks work and so forth. Because I rely on technical analysis quite a bit, one of the things I explained to them was that I look for patterns that continue to repeat. I explained to them using the old kindergarten pattern recognition test — triangle, square, circle … triangle, square — what comes next?
You may be thinking, “It’s not that easy with reading stock charts.” But sometimes it is. Look at the chart for Altria (MO) below. We see a pretty clear pattern with the stock trending lower over the last few years. You can see the downwardly sloped trend channel that I have drawn and how the stock is up at the upper rail currently.
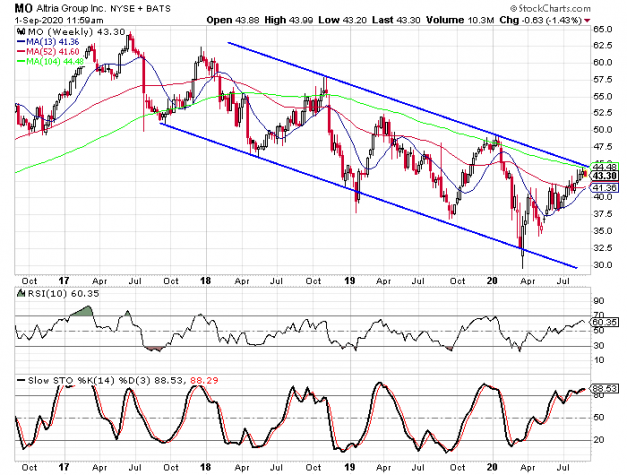
The upper rail of the channel is likely to act as resistance at this point in time. We also see a moving average in the same area as the upper rail. That is the 104-week moving average. Over the years I have been given grief for using different moving averages than what is considered standard in the investment industry. But the 13-week, 52-week, and 104-week moving averages have become my standard lengths because they represent one quarter, one year, and two years worth of data. To me, that is more important than a 200-day moving average.
The trend channel is readily apparent on the chart, but there is a little more to the cyclical pattern. If we look at the downward cycle from December ’17 through May ’18, that is a five-month move to the downside. The stock then goes through a five-month upward cycle from May through October of 2018.
Altria fell sharply from November ’18 through January ’19, a two-month downward cycle. The stock then mirrored that downward cycle with a two-month upward cycle. From September ’19 through December ’19 the stock goes through a three-month upward cycle. It then goes through a three-month downward cycle from December ’19 through March ’20.
Are you seeing the pattern yet? The cycles are mirroring one another in terms of time. At this point the stock has rallied over the last five months. If the pattern continues, the stock is now poised for a five-month downward cycle.
Bearish picture
Altria reported earnings back on July 28 and earnings were only up by 1% while revenue was down by 4% when compared to the same quarter of the previous year. Over the last three years the company has managed to grow earnings by 12% per year, but revenue has been relatively flat. Altria’s management efficiency ratings are poor with a return on equity of -9.13% and a profit margin of -4.5%.
The stock is a favorite of value investors and dividend seekers, and with good reason. Its forward P/E ratio is only slightly above 10 and the current yield is 7.8%. But I don’t think that is enough to keep the stock from making another cycle lower.
With the five-month cycle in mind, I like the January 2021 $47.50-strike puts. These options will expire on January 15 and that gives us four and a half months for the trade to play out. The stock is trading at $43.25 presently and the options are priced at $6.80. I am looking for a gain on the options of at least 100% and that means the stock will need to drop to $33.90. The stock was below the $30 level back in March, so it won’t have to break to a new 52-week low to hit our target.
