It has been quite an impressive market turnaround since the depth of the downturn back in March 2020, but the one big risk facing investors that they may not be fully positioned to take on is measurably higher inflation.
Historically, inflation as measured by the consumer price index (CPI) has averaged 2.5% annually.
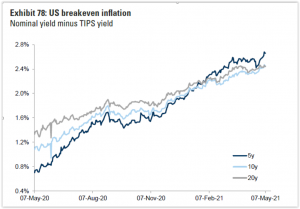
Coincidentally, if one looks at the five-year break-even inflation rate embedded into intermediate term Treasury Inflation Protected Securities (TIPS) shown in the chart below, you see an amount very close to that 2.5% level.
The risk to investors is that near-term inflation, which we will undoubtedly experience, will not be transitory but will be sustainable, and possible at a higher amount than 2.5%.
From a larger macro perspective, one can see potentially sustainable inflation drivers:
- Central banks, including the Federal Reserve, are universally not concerned about sustained inflation, which should give one concern for concern right there.
- Fiscal policy has decidedly shifted from spend now and pay later, notwithstanding the recently proposed tax increases contained in the administration’s recent American Families Plan.
- Economic globalization has taken a back seat, which has been a big factor in keeping inflation rates low.
- Worldwide population growth has also slowed, which has had a meaningful impact in keeping labor forces full and putting a lid on labor supply costs for companies.
- Labor unions are strongly supported by the current administration. While they probably will not regain the clout they had in the strike-prone 1970s, any renewed power here could push up wage inflation in a sustainable way.
At a micro level, signs are all around us that inflation is at our doorstep. Shortages of semiconductors, lumber and copper has skyrocketed the prices of those commodities.
Home prices have risen unabated as demand has overwhelmed available supply, and affordability has been high due to low mortgage rates. Automobiles, home furnishings, and medical services have all been climbing at 4% or higher in recent weeks, as reported by the Department of Commerce.
In its recently reported April report, the CPI climbed 4.2% from the year earlier level, well above expectations.
Bank of America’s research unit recently reported that the number of mentions of “inflation” during company earnings calls more than tripled year-over-year, the biggest increase since 2004.
Even individual consumers expectations of inflation have climbed over the past several months, with the latest University of Michigan survey indicating the average one-year inflation projection at 3.5% versus around 2.0% a year ago.
Winners and losers
Who are the winners in an inflationary period, and who are the losers? Since 1926, there have been eight meaningful inflationary periods lasting six months or longer, and the historical returns across asset classes and sectors have been fairly consistent.
Commodities, such as energy, timber, metals, and agriculture all tend to perform well. Despite all of the focus on bitcoin these days, gold remains a classic inflation hedge, appreciating around 13% annually during inflationary times.
Value stocks tend to outperform growth stocks by a factor of 2% to 3% annually when inflation is in gear.
And the losers? Intermediate and long-term Treasuries are the largest victims during inflationary periods, with longer dated government paper declining 8% to 10% per year during those times.
The benchmark S&P 500, which in total tends to be a large-cap growth index, on average has fallen 8% to 9% annually when inflation is at hand.
It has been many years now since inflation has reared its ugly head. This has led many investors to price assets as if inflation will never have its sway again.
Such complacency could prove costly.


