
Many investment advisors are beginning to recommend some exposure to Bitcoin (BTC) and some alternative (alt) coins, such as Ethereum (ETH).
But the biggest hurdle for many analysts is how to evaluate BTC’s value. There are many valuation models for stocks, bonds, and commodities, but when it comes to a digital asset/currency like BTC, it takes a model similar to one that measures commodity scarcity — stock-to-flow.
A popular Stock-to-Flow (S2F) model for BTC was created by an institutional investor who refers to himself as Plan B, Twitter handle @trillionUSD.
His S2F chart is shown below. It has been uncannily accurate in predicting Bitcoin’s future price.
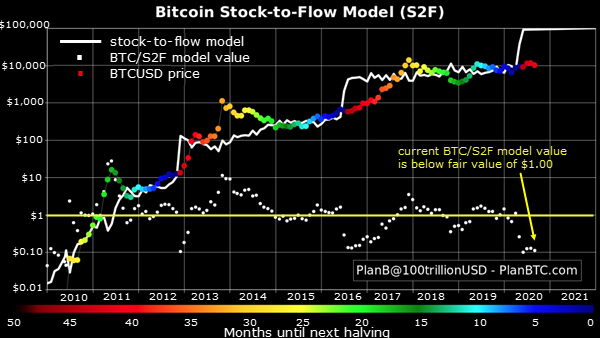
The chart’s horizontal axis runs from 2010 through 2021 and the vertical axis is a log scale of price, which starts at $0.01 and runs up to $100,000.
The solid white line is the S2F model price, which has stair-stepped higher from less than a penny in 2009 to $100,000 in 2020-2021. Each stair step is a result of the halving events, including the one in May 2020.
The halving event is when the reward for mining BTC is reduced by half. The reward is paid to a miner when his or her computer has solved a mathematical problem that confirms a BTC transaction.
A halving event occurs approximately every four years, which programmatically reduces the number of new coins entering the market over time.
This is why BTC is considered the “anti-inflationary” currency as compared to fiat currencies, which global central banks create out of thin air. The next halving event will be in 2024 and the S2F model jumps to $1 million in 2025.
The colored dots on the chart are the actual monthly closing prices, and the colors of the dots show how many months until the next halving event (the color code bar is at the bottom of the chart).
The colors go from red, equating to more than 44 months until the next halving, to blue, equating to less than five months until the next halving.
Lag and spike
The actual price for BTC, as represented by the colored dots, has cycled around the white line during its climb higher. BTC’s price tends to lag the model’s price after each halving event and then tends to spike above the line after it “catches up” with the model’s price.
The actual value divided by the model’s value is shown with the white dots along the bottom of the chart. It cycles around $1.00 (fair value) and when it’s below $1.00, as it is after each halving event, investors have a wonderful buying opportunity.
When it climbs above $1 it’s a warning to new investors — there will be better buying opportunities ahead.
A lot of new investors, especially institutional buyers, began to invest in BTC in 2020. Each halving event provides investors with an outstanding opportunity to participate in an expected rapid increase in BTC’s price.
Just a small overshoot of the model’s price in 2021-2022 would mean BTC could hit $200,000.
It’s important to note that this model predicts where price will go but it’s certainly no guarantee. However, the model continues to suggest investors would do well to have a small percentage of their investment portfolio allocated to BTC and other cryptocurrencies.
If you’d like to learn more about cryptocurrencies, crypto exchanges and the state of the crypto market, sign up for a free trial of my weekly Crypto Wealth Protocol newsletter.
