Since the market bottomed in March, the Utilities Select Sector SPDR (XLU) has rallied over 30%. Even after the rally the fund is down over 8% on a year to date basis, but that is much improved from the nearly 30% decline through the March 23 low.
Even though the XLU has rallied nicely, there could be some bad news for investors and it’s coming from the daily chart for the fund. There are three different patterns that suggest a move lower is likely in the coming weeks. The first pattern is a simple trend line that connects the highs from February and June. That trend line is currently just below the $60 level and just above the current price.
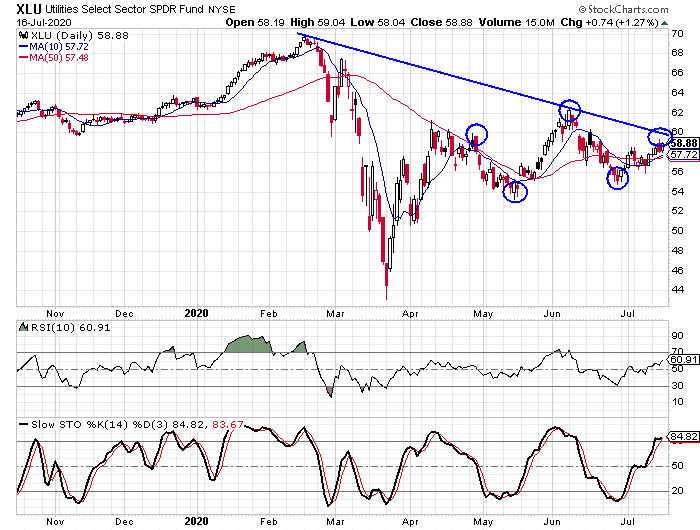
The second pattern is a little more complicated, but it is called a head-and-shoulders pattern and it’s also a bearish pattern. We see the high in April forms the left shoulder while the low in May forms the left side of the neckline. The high from June forms the head and the low at the end of June represents the right side of the neck. The right shoulder would be formed in the $59-$60 area, matching the left shoulder in April. For the pattern to be confirmed, the stock will have to drop below the neckline in the $54-$55 range. Breaking that support would likely send the XLU down to the $50-$51 range and would represent a decline of approximately 15%.
Something else that should be made note of is the daily stochastic indicators and the fact that they are in overbought territory and look as if they may make a bearish crossover in the next few days. That would be yet another potential bearish signal for the fund.
Fundamentals Slightly Above Average for the Sector
Using Investor’s Business Daily’s EPS ratings and SMR ratings, the utility sector as a whole is slightly above average in its fundamental ratings. The EPS rating measures the earnings growth for the past three years with a heavier weighting on the more recent quarters. The SMR rating looks at sales growth, profit margin, and return on equity. In IBD’s database there are 64 companies in the utility group. The average EPS rating is 66.33 and that is slightly above average on the scale of 1-99.
On the SMR grading scale, the best score a company can get is an A and the worst grade possible is an E. There are only five “A” ratings and 11 “B” ratings out of the 64 companies. The vast majority of the companies get a “C” grade and that is average. There are 37 companies with a C SMR rating. Eight companies receive a D and one company gets an E rating. One doesn’t have an SMR rating and that usually happens when a company is losing money and therefore a return on equity isn’t really calculable.
The utilities sector is generally considered one of the safe-haven sectors along with consumer staples. Historically we have seen the sector hold up better during market downturns, but that historical norm didn’t really hold up during the meltdown in the first quarter. From the high on February 19 through the low on March 23, there were six different sectors that performed better than the utilities sector.
Regardless of what the overall market does over the coming weeks, the short term outlook for the XLU suggests that a move lower is more likely. There are too many factors adding up on the bearish side with the trend line, the head-and-shoulders pattern, and the likely bearish crossover from the stochastic indicators.
