
Anyone in the realm of finance or the stock market knows Warren Buffett. He is the billionaire CEO of Berkshire Hathaway and has been one of the world’s best investors for decades.
That is why when he talks about warning signs of a potential crash coming soon, I pay attention.
Warren Buffett has a market indicator that he believes is the single best indicator of where the market currently stands.
Here is a quote from him in 2001: “It is probably the best single measure of where valuations stand at any given moment.”
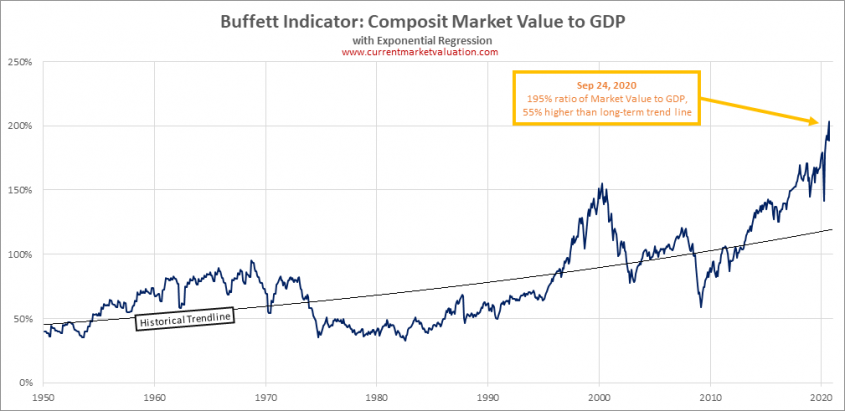
The indicator he is referring too has been labeled the “Buffett indicator.” It takes the combined market capitalization of all U.S. publicly traded companies and divides it by quarterly GDP.
Clearly this is not the only indicator that matters, but Buffett believes it is the best for understanding if the current stock market is overvalued or undervalued.
Does this indicator actually help?
It’s easy to jump on board with something just because one of the wealthiest and most successful investors in the world says so.
However, I like to see a pattern or history that shows specific things to hold true, or at least be worth paying attention to.
I am sure many people can remember back in the late 1990s when the internet was starting to take the world by storm. This lead people to be overly optimistic and drove tech-stock prices up beyond what they were capable of sustaining.
This was known as the “dot-com bubble.”
If you take a look at the “Buffett indicator” during this time, it actually reached an all-time high up to that point. This means that the market was extremely overvalued and the possibility of a hard crash was very possible.
And, as history shows us, that is exactly what happened.
Fast forward to 2020 where the market is in a recession and the world has been flipped upside down by a pandemic. And what do you get?
An all-time high for this indicator (195%) which tells us that the market isn’t just overvalued, but way overvalued.
To me, this means that a potential crash is not only possible but near.
What does this mean to investors? Well, I believe that you have two options depending on your investing strategy.
- Option one, you can work on getting out of any stocks you currently hold to free up your money and have as much cash on hand as possible if the market does come crashing down.
- Option two, which is the category I fall under because I am a longterm investor, is to hold on to any companies you have that you feel confident about and have strong balance sheets and work on getting more cash on hand by other means.
An opportunity?
Either way, I believe it is smart to have cash ready to use if the market drops hard again and stocks start getting cheap like they were back in March.
I believe this indicator is a great tool to use when evaluating stocks and your personal investing strategy, but you should always read as much as you can and never rely on one single thing.
Also, this is not an indicator that “times” the market or “predicts” exactly what is going to happen because that is impossible, regardless of what the Wall Street guys tell you.
This is just another tool to put in your investing toolbox, and you’d be wise to do so.
