
Gold and silver have been on tremendous runs lately. Gold is up over 40% from its March low while silver has more than doubled.
If you are long precious metals stocks, metals ETFs, or the metals themselves, congratulations on your gains.
At this point, however, you might be asking yourself it’s time to look at taking profits on all or part of your position. I have an indicator for both gold and silver that I believe will help you determine when it is time to start taking profits.
I have been studying sentiment analysis for 20 years now and there is no better sentiment indicator than the commitment of traders (COT) reports for commodities. The COT reports are issued by the Commodity Futures Trading Commission each Friday.
The reports show the collective holdings of three different categories of investors. There are large speculators, small speculators, and commercial hedgers.
You can find the reports in a number of places, but I like to use BarChart.com because it has the COT numbers as an attachment to the chart for the commodity.
Personally, I find the large speculators to be the most influential because these are the big money investors that can swing the market one way or the other.
From what I have found, there seems to be certain thresholds that mark a point where the sentiment is too bullish for both gold and silver.
Watch large speculator volatility
The weekly chart of gold is below and it has the COT levels at the bottom of the chart. Large speculators are marked in green and we see that the group as a whole is net long 236,801 contracts.
That level is good news for the price of gold because if you look at the four red lines on the chart, those are instances where large speculators were net long more than 300,000 contracts.
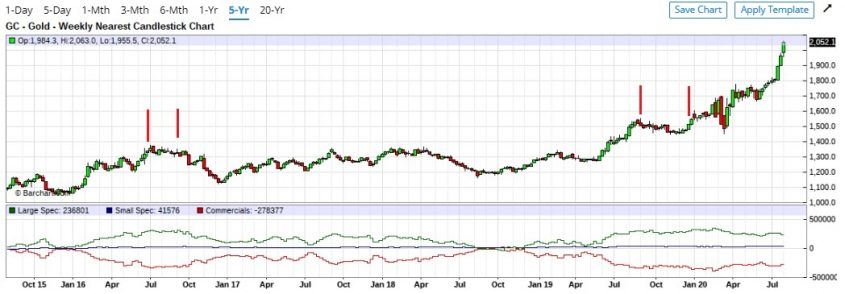
Notice how gold prices slipped, or at the very least became more volatile, when large speculators became too bullish. (Please note that the group may have held more than 300,000 for a few weeks in a row, but the lines mark the first week when the threshold was crossed.)
Silver also has a threshold that seems to mark a point of too much optimism. The magic number for silver seems to be the 60,000 mark.
When large speculators hit that level of optimism, that’s when prices become more volatile. The report from July 31 shows that large speculators are net long 27,308 contracts.
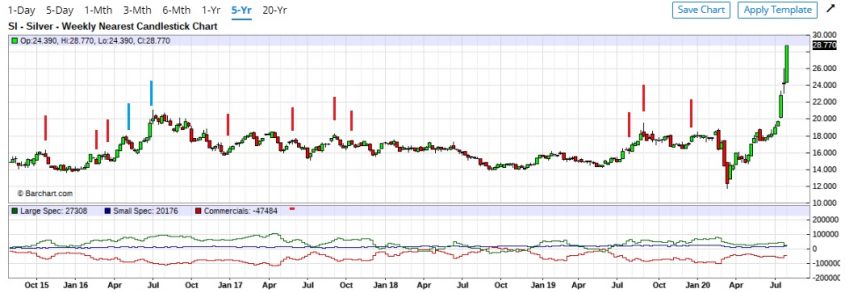
The red lines mark the times when the 60,000 mark was crossed and like we saw with gold it is the first week when the threshold is crossed that is marked. I also marked two weeks in 2016 with blue lines. In those instances the net long position reached 80,000 contracts.
My advice to gold investors is to watch the COT reports. If large speculators reach the 300,000 contract level on gold, consider taking some profits off the table.
For silver investors, it could be a two step process. Take partial profits when the 60,000 threshold is reached and more, if not all, when the 80,000 level is reached.
