Bitcoin has had a nice rally in the past week, up about 14% from its low near $6,250 to a high of $7,126 on August 28th (the time of this writing). Other altcoins have done even better.
So is this it? Is this the start of the new bull run for Bitcoin?
I wish I could feel more bullish about Bitcoin’s chances for a continuation of its rally from the August 14th low at $5,858 but I’m not convinced of that yet.
Note that Bitcoin has again made it up to its broken uptrend line from June and July, currently near $7,000.
This trend line stopped the rally on August 22nd. BTC has also run into the top of a small rising wedge pattern for the bounce off the August 14th low.
The top of the little wedge is currently near $7,200 (on August 29th).
- Exclusive Access: Get Keene Little’s Crypto Wealth Protocol delivered to your inbox!
A rising wedge is a bearish pattern. To negate this pattern, BTC must hold above $7,200. Also near $7,200 is the 50% retracement of BTC’s July to August decline (50% is a common reversal level).
This makes $7,200 a potentially tough resistance level. Time will tell if the bulls can crash through it.
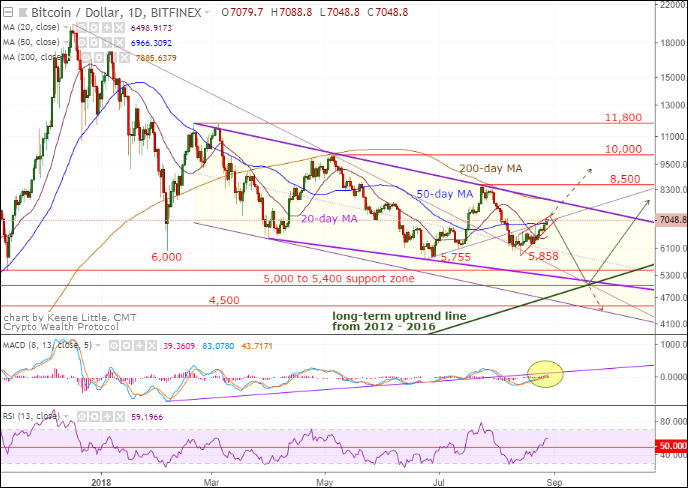
If the BTC rally does continue, we’ll then watch to see how it does with resistance near $7,900, where it would test its declining 200-day moving average (brown line) and the top of a descending wedge pattern (bold purple lines).
The rally into the July 24th high, near $8,500, stopped at the top of the descending wedge pattern and just short of the 200-day moving average.
That makes both lines near $7,900 tough resistance until proven otherwise.
If the current bounce fails and we get another leg down, depicted with the green line, we could see the $5,000 to $5,400 support zone finally tested.
We’ll have time to evaluate what to do if it happens but there remains the potential for a very important bottom there.
As we wait to see how crypto prices perform from here, one subtle hint could come from the Bitcoin futures market.
Bitcoin futures have been trading for only about eight months, since last December, so there’s not a lot of history to judge the current level of bullish and bearish bets.
But the current short interest (how many futures contracts are “short” the market, meaning betting on the market going down) is at a record low.
Contrarian signals
Short interest can be used as a contrarian signal. When short interest is high (a large number of traders betting on the downside) it can be a reflection of too much bearishness in the market.
A rally then starts traders covering their short positions (buying back the contracts to close the position) and that can lead to a more powerful rally.
When short interest is low it’s a reflection of traders feeling more bullish than bearish but from a contrarian perspective it can set the market up for a tumble.
A decline could spark selling by traders, including selling contracts short, and the combination can drive the market lower.
- Special Report: Learn the powerful secrets of serious cryptocurrency investors — before Wall Street catches up!
With the current record-low short interest I have to wonder if the bears have prematurely left the field.
If BTC is unable to rally above $7,200 we could see short interest climb back up again as traders start betting on the downside.