
Although interest rates have started to creep back up so far this year, we all know they are still pretty low right now.
I just wanted to show one mind-numbing chart, courtesy of the Bank of England, that illustrates just how low they truly are. See below.
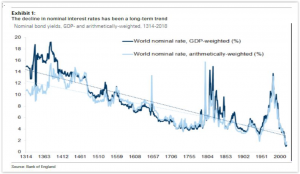
Not too many financial charts take you back to the early-1300s, as does this one! What is interesting here is the steady decline of the 10-year global nominal interest rate over this 700+ year period.
I attribute much of this very long term secular decline in nominal rates to the constant lowering of the risk premium as civilization and the world economies have evolved.
Now, just focusing on the past 20 years since the early 1980s, we see this incredible move lower in worldwide rates up to the present time.
The Bank of England used two methods to show this, GDP-weighted and population-weighted, but the end result is the same. We are truly at historically low levels of interest rates, and this has had and will continue to have an incredible impact on how all financial assets, including stocks, bonds, commodities, etc., are valued.
Looking at this chart though, one may note and envision a major inflection point starting to form with the lines ever so slowly starting to take on an upward path.
All investors need to take note of this. I believe we have witnessed a steady creep back up away from this long-term downward trend line over the past several weeks now.
One additional chart from Bloomberg is shown below, and it is certainly related to the chart above. It shows the percentage of global fixed income securities that are yielding a negative number. Refer to the chart below.
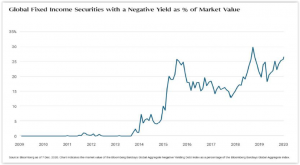
As of the end of early December 2020, more than 25% of global bonds were negative-yielding. Bond investors in these securities were paying the bond issuers each year to hold their debts!
It is hard to imagine that this situation can continue to persist over the next several years, as it defies the basic concept of fixed income investing — holders receive interest as an incentive to owning these securities.
It certainly illustrates very well that the search for yield by investors is at an enormous level across the entire world.
The above really brings home the point that investors are starved for income currently.
A cautionary comment is that they could meaningfully elevate their principle risk exposure, willingly or unwillingly, as they desperately seek to pursue high income levels on their investments.
